Timeline
This widget allows the user to quickly determine whether the expected changes are occurring, the time lag between different devices (the X axis value is defined by the tango attribute timestamp), whether a state is ever reached, and how long a device remaina in a given state.
The order on the y-axis in each swimlane can follow the “natural” ordering of the attribute or state range (eg. the order of the enum provided by Tango).
A shared swimlane can be used for attributes A1,A2, … only if the set of values of these attributes is identical. Attributes A1 and A2 are never placed in the same swimlane if their sets of values differ.
Widget settings
The following image shows an example of a widget setting.
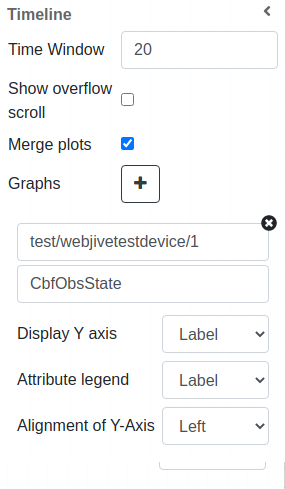
It is possible to customize the widget setting from the inspector panel (in edit mode), as below:
Input value |
Description |
|---|---|
Time Window |
Defines how much time (in seconds) is shown on the x-axis of the plot |
Show Overflow Scroll |
Enable scrolling |
Merge Plots |
Merge plots when enabled |
Show Tango Database Name |
Displays the tango database name when enabled |
Legend Position |
Change the position of the legend by choosing between the options: Top (above the plot), Bottom (below the plot), or Inside (inside the plot, in the top-right corner) |
Graphs |
Opens the configuration for individual plots (see below) |
Graph configuration
When clicking on the Graphs option, a new plot can be configured with the following settings:
Input value |
Description |
|---|---|
Device |
Type in a device name (or * to list all) |
Attribute |
Once a device is selected, type in an attribute name (or * to list all available attributes) |
Display Y Axis |
Select the Label, or Number for the Y axis |
Attribute Legend |
Select the Label, or Name for the attribute legend |
Alignment of Y-axis |
Aligns the Y axis to the right when enabled |
Attribute selection
Taking the SKA webjivetestdevice as an exampel, we can see here all the DevEnum and DevState attributes available for selection:
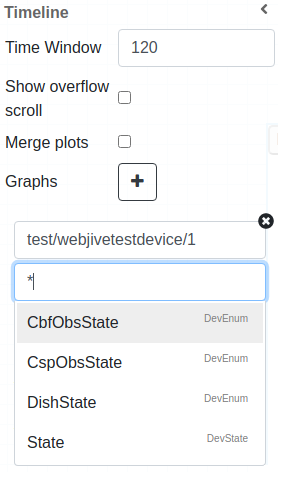
Note
At the moment, this widget supports only enum-typed and DevState attributes (such as obsState and State for SKA devices).
Additionally, at runtime, you can click the Hide/Show Legend button to toggle the legend’s visibility.
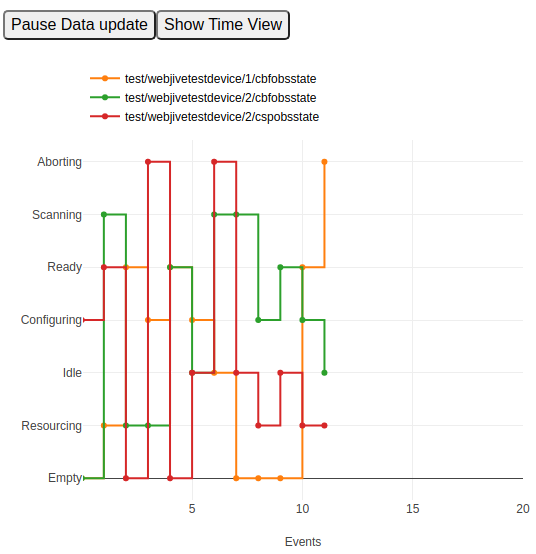
Widget look and feel
The following iamges show how the widget appears in a running dashboard.
The user can add swimlanes by clicking the + button in the widget inspector.
These are some of the types of widget displays available to the user:
Three DevEnum attributes displayed in event view, not grouped:

Three DevEnum attributes displayed in event view, grouped:
Three DevEnum attributes displayed in time view, grouped:

Three DevEnum attributes displayed in even view, grouped
In this case, the attribute dishstate has different labels, so the widget decides which ones can be displayed together:

Example of State attribute:

A set of default Plotly tools is displayed at the top of the widget, providing functions such as capturing a picture, zooming, panning etc.
