Elasticsearch Log Viewer
* Update on 06/04/2023 this widget now only works with STFC and uses taranta-dashboards backend to communicate with it, if the URL is not accepted a warning message will appear *
The widget shows the log coming from an Elasticsearch server.
Widget settings
The following image shows an example of a widget setting.

It is possible to customize the widget setting from the inspector panel(in edit mode), as below:
Input value |
Description |
|---|---|
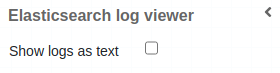
Show Log as Text |
Switches message fields display between table or text |
Search Input |
Allows text introduction to filter message field |
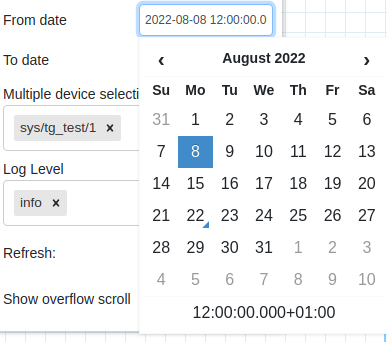
From Date |
Date/Time introduction to filter FROM message timestamp field |
To Date |
Date/Time introduction to filter TO message timestamp field |
Multiple Device Selection |
Allows multiple device dropdown selection |
Log Level |
Allows log level dropdown selection |
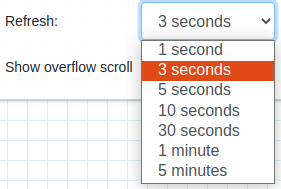
Refresh |
Sets the refresh time to query elasticsearch |
Show Overflow Scroll |
Forces scroll on the widget box |
Custom CSS |
Write custom CSS for the widget container. The syntax is the same as standard CSS used in HTML files |
Elastic widget device selection filter:

Elastic widget log level selection filter:

Elastic widget refresh time filter:
Elastic date/time selection filter:
Elastic widget type (table or text) of display selection:
Widget RunCanvas
RunCanvas live filters available:

Elastic widget fields as columns:

Elastic widget fields as text:
