Spectrum Table
A widget that allows plotting a spectrum attribute in a table.
The widget shows a table coming from spectrum attributes.
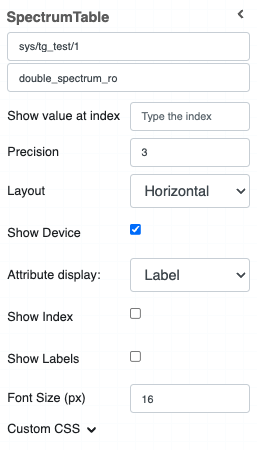
Widget setting
The user has the ability to:
Select the device and the spectrum attribute to plot in the table
Precision: the precision to show for each value in the table
Layout: the user can select the table layout: horizontal or vertical
Show device: if selected, show the device name
Attribute Display: select if show the name or the label of the device in the title. Label is shown as default
Show index: if selected, it shows the index (0,1,2,3…) in the table header
Show index: if selected, it shows the Labels (Index: , Values, ) in the first column of the table
Customize the CSS of the widget
Widget design
Once plotted, the result is like the following image:
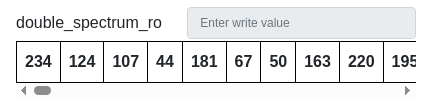
Note: The text field in the widget is disabled for read only spectrum attribute and the same is enabled for ReadWrite spectrum attributes.
Writing value to spectrum
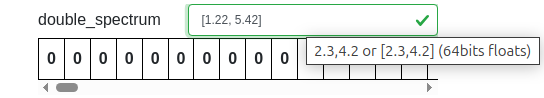
User can use the text field to input value to write the spectrum attribute.
The text field will show error icon for incorrect value. User can hover the text field to know about correct input value.
Once user enters correct value, the text input field turns green. Press enter to write value to spectrum attribute.
Once value is written, text field is cleared as below:
![]()